![]() USU
››
Programs for business automation
››
Program for the shop
››
Instructions for the program for the store
››
USU
››
Programs for business automation
››
Program for the shop
››
Instructions for the program for the store
››
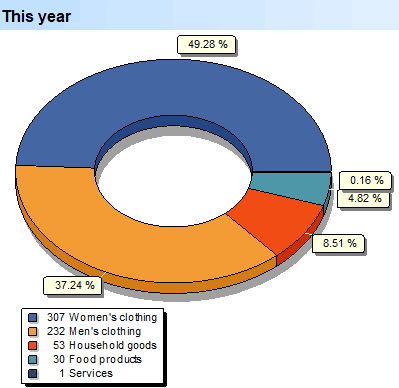
In the ' USU ' program, sales volume analysis is performed using a special report. Report "Volumes. Groups" used to evaluate in terms of sales volumes.
Graphical representation of the volume of transactions by product category for the current year.
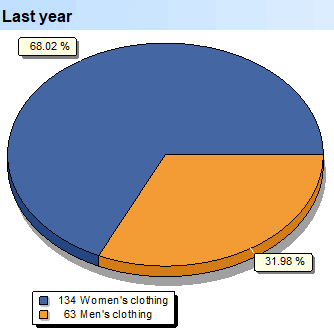
Graphical representation of the volume of transactions by category of goods for the previous year.
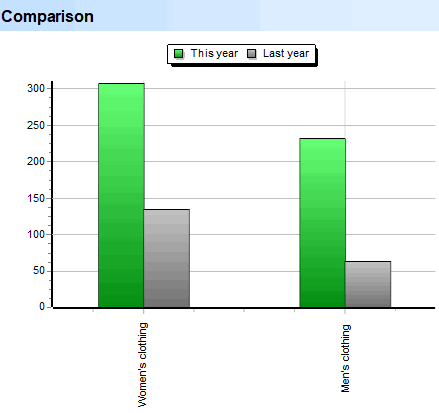
Comparison of transaction volumes by product categories for the current year with the previous year.
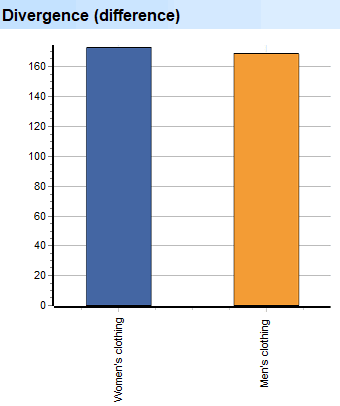
The total difference in the volume of transactions by category of goods for the current year with the previous year.
Sales volumes for each month of the period.
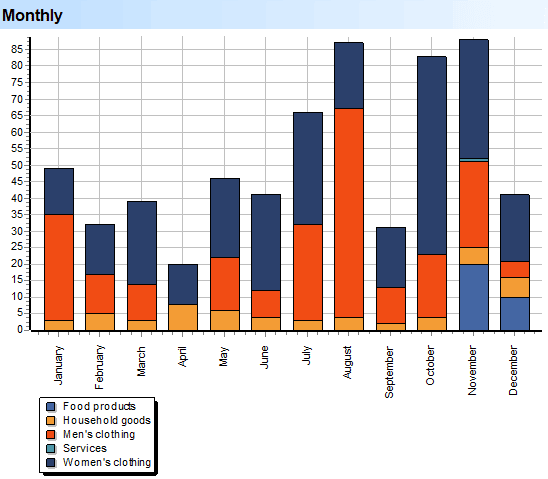
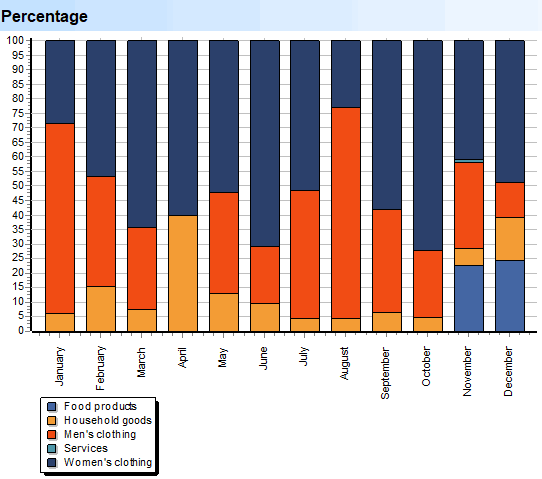
Displaying the percentage of sales volumes for each month of the period.
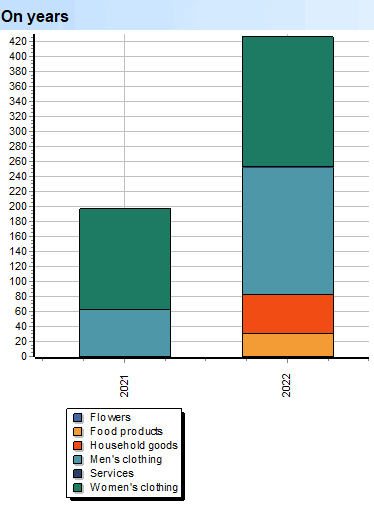
Change in the volume of transactions for each category of goods by years.
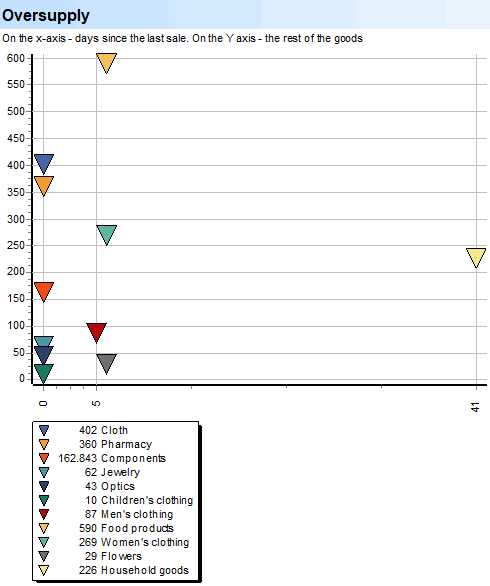
It is important that all groups of goods and services are sold. This analytics will show the excess supply by category of goods - that which is not sold often enough, but is available in large quantities. The "X" axis shows the number of days since the last sale, the "Y" axis shows the balance of goods in stock. Ideally, all pointers on the x-axis should approach zero.
See below for other helpful topics:
![]()
Universal Accounting System
2010 - 2026
 Download the program with interactive training