![]() USU
››
Programs for business automation
››
Program for the shop
››
Instructions for the program for the store
››
USU
››
Programs for business automation
››
Program for the shop
››
Instructions for the program for the store
››
In the ' USU ' program, employee analysis is performed using a special report. Report "Employees" dedicated to the analysis of employees.
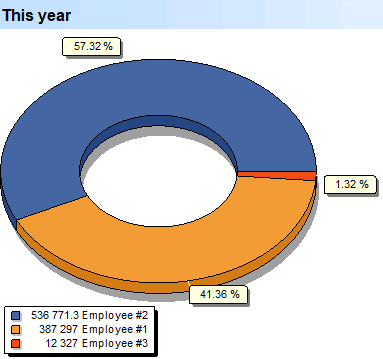
A lot depends on your employees. And first of all - the amount of funds that the company earns with the direct participation of each specialist.
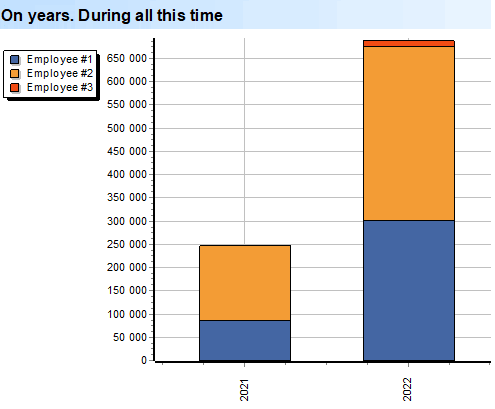
The graph shows the contribution of each employee to the company's income in the current year.
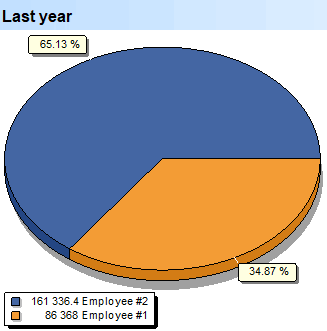
The graph shows the contribution of each employee to the company's revenue in the past year.
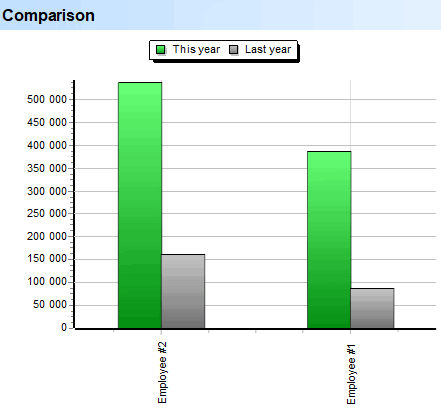
The report allows you to see the growth or degradation of each employee compared to the previous year.
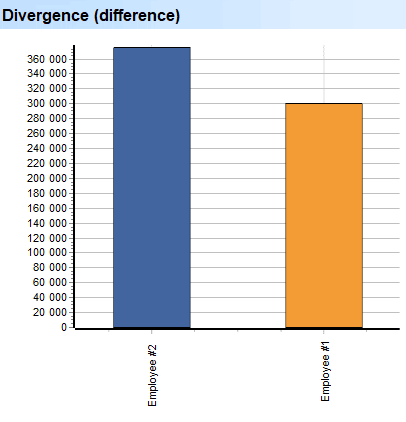
The graph shows immediately the difference between the two years.
Comparison of the amount of contribution of each employee for each month for a visual analysis of changes and amounts.
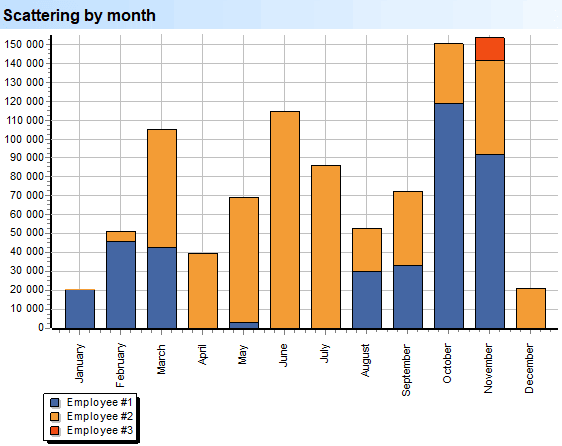
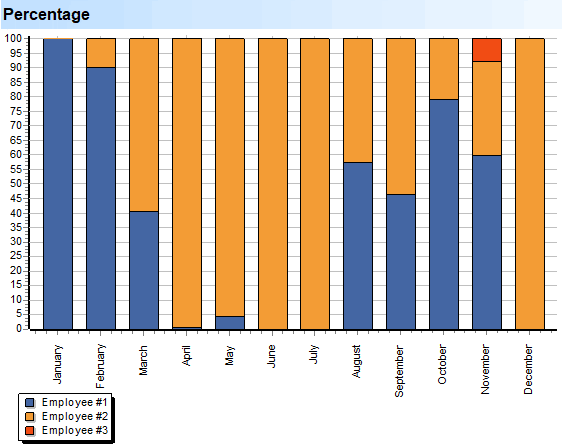
The ability to look at the dispersion of income from each employee by month, neglecting the amounts, leaving only the percentage. In this view, changes will be much more difficult to get lost.
Comparison of ratios at once by years to estimate a long period.
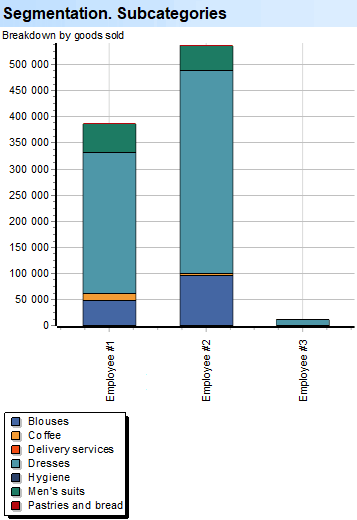
Through “ segmentation ,” you can even determine for each employee which groups of goods and services he can sell best. And at the same time, it is possible to understand for each nomenclature group by which workers it is mainly distributed.
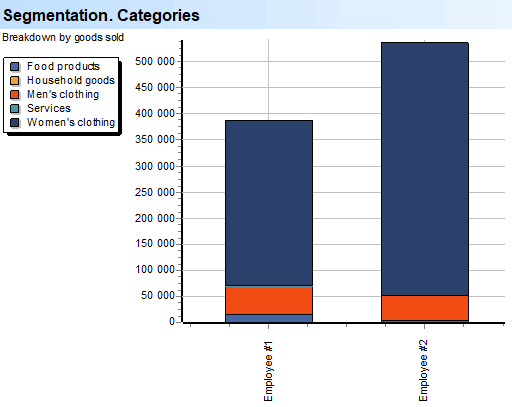
A more detailed analysis is already on the subcategories of goods and services.
See below for other helpful topics:
![]()
Universal Accounting System
2010 - 2026
 Download the program with interactive training