![]() USU
››
Programs for business automation
››
Program for the shop
››
Instructions for the program for the store
››
USU
››
Programs for business automation
››
Program for the shop
››
Instructions for the program for the store
››
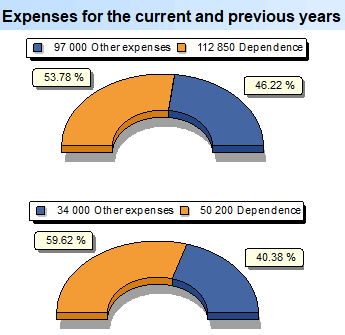
In the ' USU ' program, the analysis of mandatory expenses is carried out using a special report. Report "Expenses. cabal" used to analyze "bondage" - these are expense items that put the business owner in complete dependence.
For some it's "wages", for others it's "taxes". For others, it could be both.
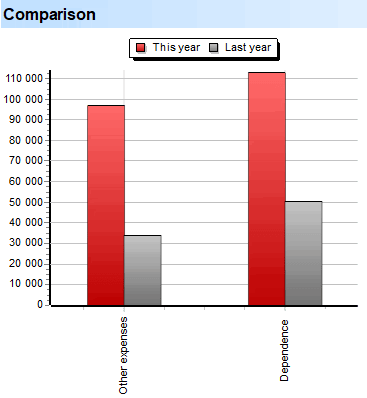
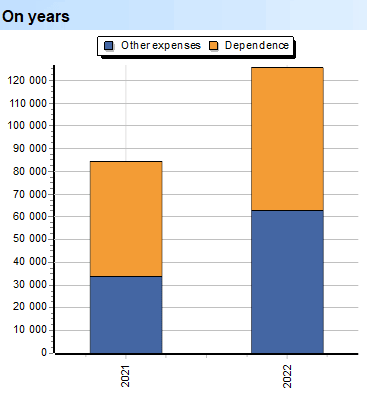
The two graphs show spending for the current and last year.
Dynamics of changes in expenditures of the current year compared to the previous year.
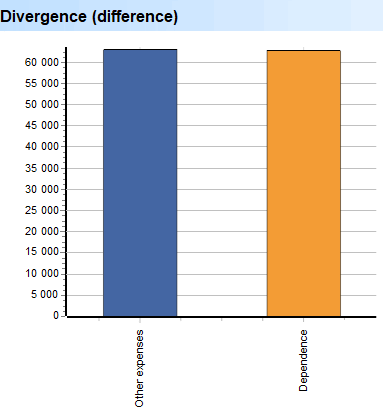
The total difference in spending over two years.
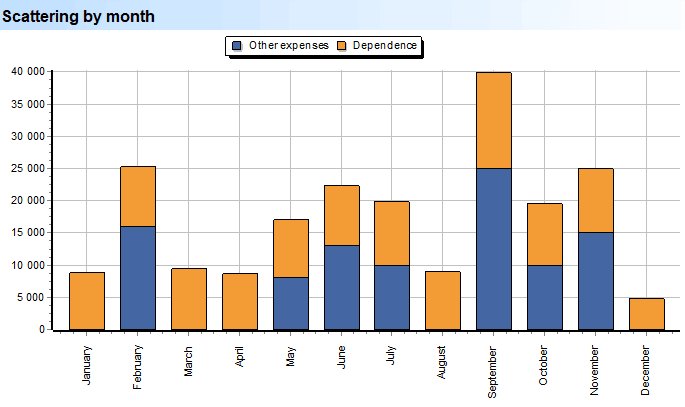
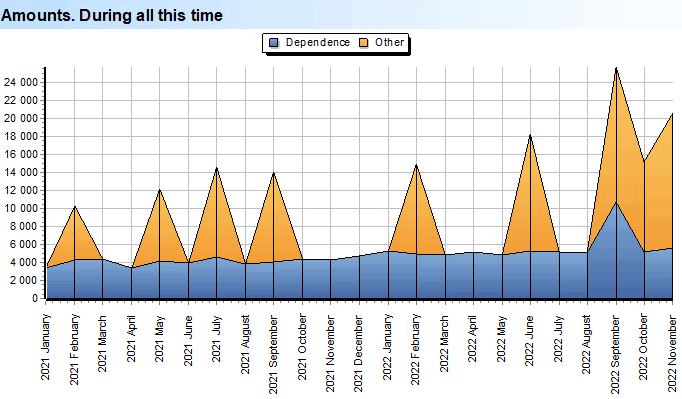
Comparison of the amount of bondage with other expenses for each month for a visual analysis of changes and amounts.
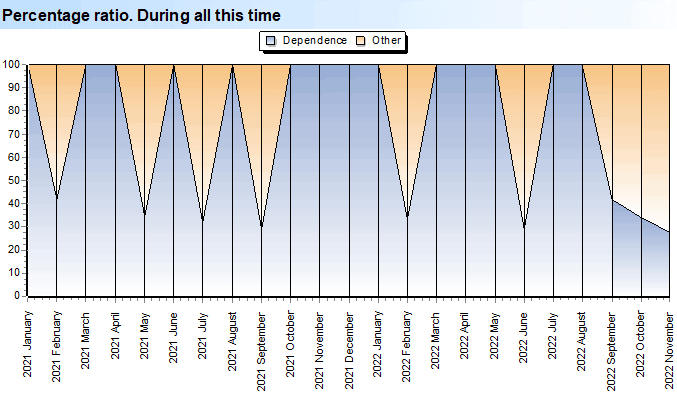
Comparison of ratios at once by years to estimate a long period.
The graph is used for visual analysis of changes in the dynamics of expenses for each month of the period.
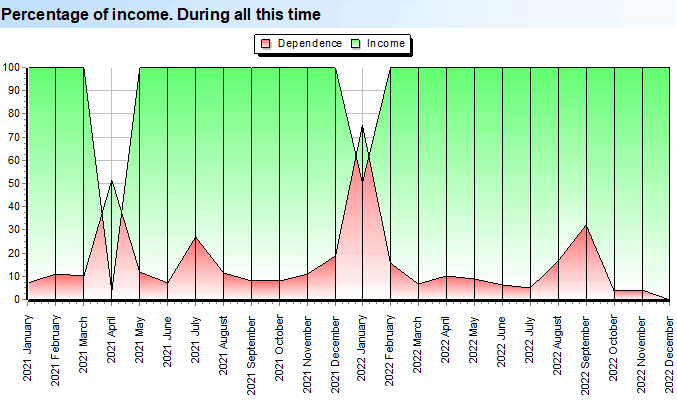
The next step is to look at the dispersion of expenses by months, neglecting the amounts, leaving only the percentage. In this view, changes in spending will be much more difficult to get lost.
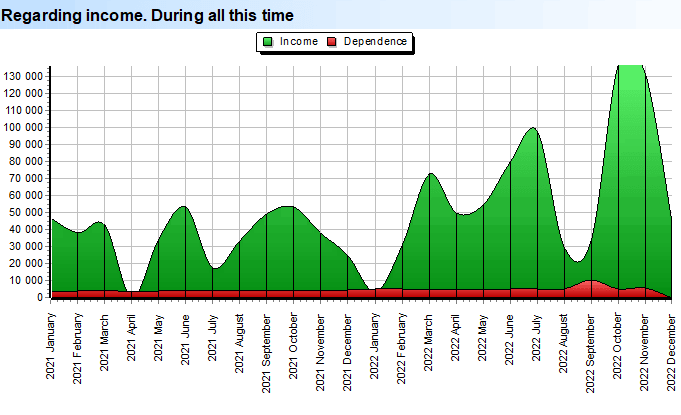
This is an analysis of the bondage regarding the amounts of the company's income.
On the chart, an analytical view with ignoring amounts, where only percentages appear.
See below for other helpful topics:
![]()
Universal Accounting System
2010 - 2026
 Download the program with interactive training