![]() USU
››
Programs for business automation
››
Program for the shop
››
Instructions for the program for the store
››
USU
››
Programs for business automation
››
Program for the shop
››
Instructions for the program for the store
››
In the ' USU ' program, the analysis of groups of goods is performed using a special report. Report "Goods. Groups" is used to evaluate the groups of goods sold and services rendered in financial terms.
Selective demand is the demand for goods and services of various types, which are more or less chosen by the consumer.
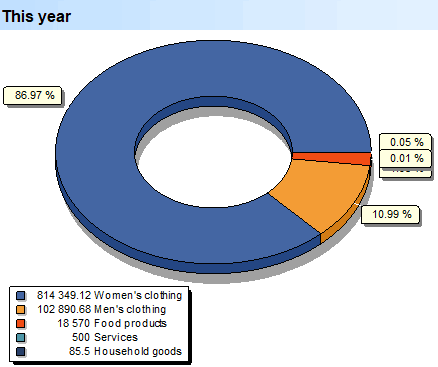
The first graph is a comparative analysis of how much your company earns on groups of different kinds of goods and services. The legend shows the value in monetary terms, and next to each sector, a percentage is displayed relative to the total earnings for the current year.
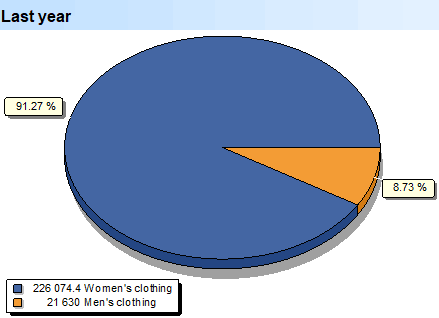
This is an analysis of your earnings by product group for the past year.
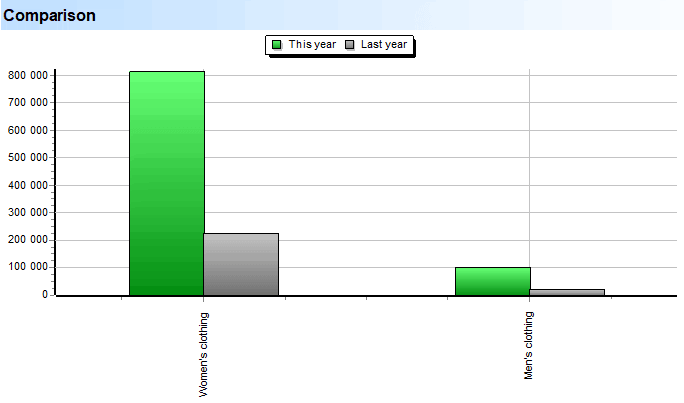
This year's demand must be compared with last year's. It is very convenient to do this when the data is displayed on the same plane, where the gray color indicates the previous year.
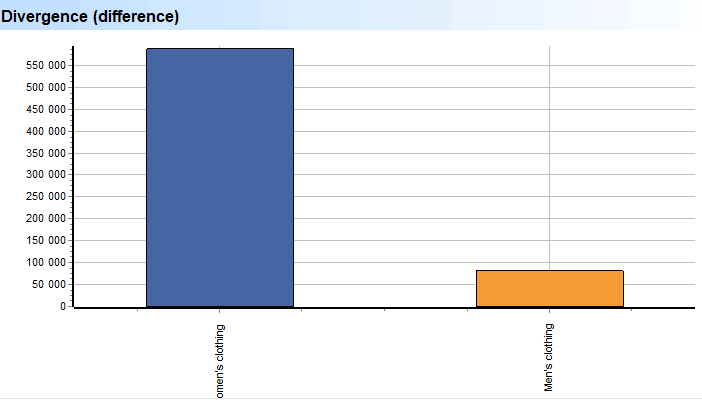
" Divergence " is the difference. Moreover, the product groups are displayed in order from maximum success to minimum. First, those who began to buy much more compared to last year, and at the end of the list will be those whose demand increased the weakest or, worse, even fell.
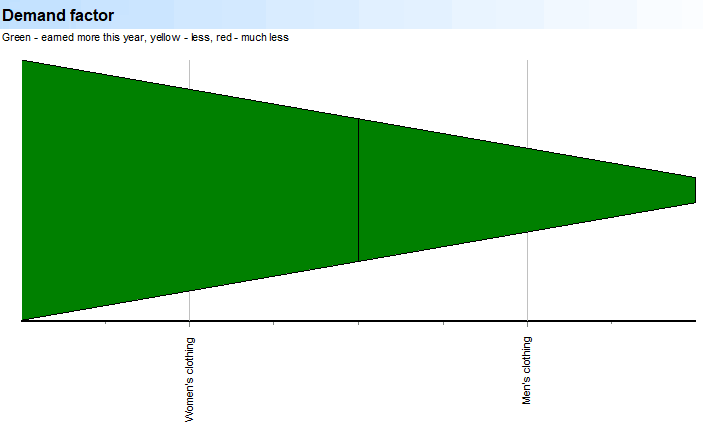
This is a demand analysis without financial values. Each group of goods or services is a section-vessel that may or may not be filled completely. If the section is full, then demand this year has exceeded last year's figure. If the demand in the current year was worse - the color is yellow, much worse - red.
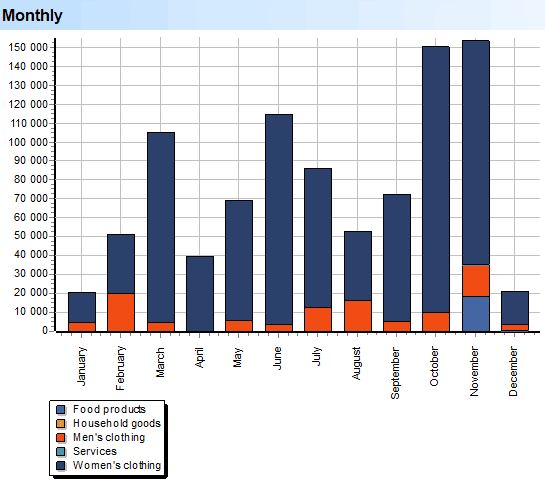
For each month, it is clear from the sales of which particular groups of goods and services the income was formed. And also for each group of goods it is shown how it developed and was implemented in each month of the year.
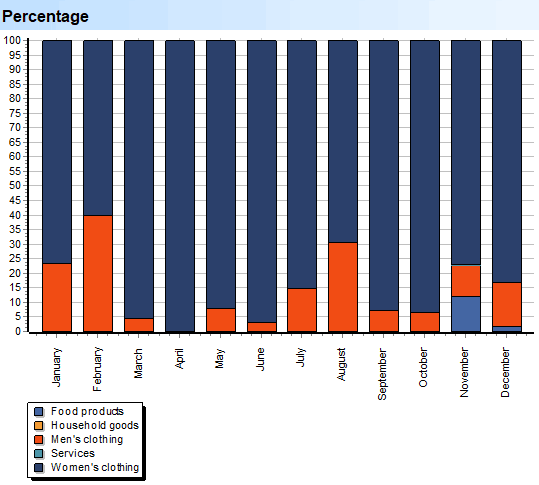
An analytical view of the implementation, ignoring the amounts, where the income for each month is taken as one hundred percent.
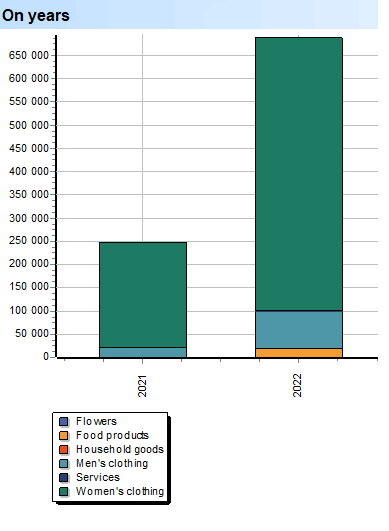
And, finally, an enlarged analysis of dispersion by years. If some groups of goods and services appear and disappear in the process of developing your enterprise, then in this diagram they will be presented in full.
See below for other helpful topics:
![]()
Universal Accounting System
2010 - 2026
 Download the program with interactive training